home
needs
local resources
comfort
safety & health
contact
reports
Market Size
Turning back to fig.1, we see that the only other direct input to design is the manufacturing system available to the designer. However the manufacturing system in principle can be chosen by the designer. The choice is dictated by the material resources on the one hand and the market size on the other hand. The discussion on the material resources is largely a technical one . In the rest of this section we will concentrate on market size.

Fig.1.The design enterprise
We see from fig.1 that the market size is influenced by a number of factors. We shall consider each one of these in turn.
Population
We presented a set of projections made by FAO (1981) of populations living in regions of acute scarcity or deficit fuel wood supply in the year 2000. These projections suggest that the number of customers for improved stoves can be of the order of 500 million. This number conjures up visions of a mass produced product sold to millions of households.
In this context it is worth while examining the prospects for mass producing stoves around the world. There are obviously several advantages to be gained by considering a mass production system. Invariably such a system is capable of producing a standardized product. Secondly the cost can be considerably smaller if one goes by the experience of the industrialized countries of the world. However the experience of the developing countries of the world is mixed in this respect. If the hi-tech product experience in developing countries is any guide, one is forced to conclude that the claims on behalf of the mass production system should be treated with caution. We nevertheless feel that some of the procedures of the mass production can be borrowed with profit for producing stoves. It is in this spirit that we will consider various factors that go to determine the annual sales of, say a hypothetical stove factory. The fundamental assumption made in the following is that the design is of the single pan metal/ceramic stove type several of which the reader will have come across on ohter pages .
Market stratification
The first and foremost fact to recognize while planning the production system is that the market for stoves is simply not homogeneous. It is pointless to work with global numbers such as those of FAO if one wants to call her/himself as a serious designer. The first type of stratification is based on the national boundaries. Even in the two largest countries of the world, China and India, where the clientele for stoves are of the order of several hundred million there does not exist even talk - let alone plans - of a factory producing a million stoves per year. Thus the population unit one can work with will vary between 10 and 50 million.
The second level of stratification is that between urban and rural markets. We advance the thesis that large towns have a fairly strong commercial relations with villages surrounding them. Thus it is to be expected that a proportion of rural population will be prospective customers for the products from our hypothetical factory. This size can grow with time if one conceives of innovative approaches to marketing and financing. Furthermore study after study has shown that urban demands for fuel wood, charcoal, and other timber products have contributed much more to deforestation rather than rural fuel use (see for example Beijer Institute, 1982 and Reddy & Reddy, 1983). At a modest estimate at least a third of the current rural population around the concerned urban area can be thought of as potential clientele for the stoves produced according to the precepts of mass production.
While trying to provide the customer profile we alluded to two other possible types of stratification. The first is based on the type of food and the other on the quantity of food. During that discussion simple methods of overcoming these obstacles at least in a conceptual sense were suggested. In principle these two should not place a serious limitation on the mass production system as one recognizes from the apparel industry.
With this type of information it is possible to provide estimates for the stove market. This has been done for several countries in Africa and presented in Table 9.6 (Krishna Prasad 1985). It is instructive to provide the assumptions made while constructing this table. The family size was taken to be 7; each family needs two stoves (since we are considering single-pan stoves); the life-time of a stove is 2 years. This last choice has been dictated by three considerations. A longer life-time will inevitably involve superior materials and consequently superior production facilities. Inevitably such a stove will cost more with an adverse effect on possible market size (thus we might lose the battle for mass production even before we start). Finally such a built-in obsolescence will not only provide time for the engineering fraternity to come up with better designs than the ones contemplated now but also hold the capital costs of production systems to modest proportions. Finally the last column in the table is based on an estimate given by Krist-Spit on the basis of work done in Mali (1984).
The table shows that in most of the countries considered there is no case for contemplating production units with capacities in terms of a million stoves per year. In particular if we take into account the fact of market penetration rates the production rates will go down further by factors of 5 or more (see later).
The fifth type of stratification is based upon on the economic status of the households. This is a vexing question and one could devote an enormous amount of space to considering this problem. The author is not a development economist and as such will desist from an elaborate discussion on this aspect. But yet the designer and the producer should be aware of the fact that the ability to pay will vary among the population and should take sufficient measures to capture as large a slice of the total market as is possible. One way of doing this is to design stoves for low, middle and high income groups in virtually the same manner as we considered small, medium and large stoves. We will consider alternatives modes of production and later in this section treat the question of ability to pay based on some field data.
There is a sixth type of stratification that can be recognized from the work of Reddy & Reddy (1983) on the use of fuel wood in the city of Bangalore. This city has(d) 595,000 households out of which 267,000 use fuel wood. However, while all the households use it for water heating, only 143,000 households use fuel wood for cooking. In other words there is a much larger market for water heating stoves rather than for cook stoves. Water heating device is a much simpler one as the reader would have realized from other pages. Thus it probably is more profitable both in terms of business for the factory and from the environmental point of view of saving wood. Reddy & Reddy extrapolated the findings of their work to the whole of the state of Karnataka (restricting the definition of urban areas to population centres of 20,000 or more in contrast to the the number of 5,000 used in the original paper) the water heating stove market is of the order of 1.53 million. To put this in perspective the population of the state of Karnataka as reported by the authors is 47 million. Thus our hypothetical factory should consider producing two designs of stoves - one for cooking and one for water heating. Earlier we have suggested different types of stoves/ovens that would be required for baking breads like injera, rotla and nan.
Before leaving this section it seems useful to answer the question: the improved woodstoves have been talked about for at least 15 years now; what is the track record of the efforts? The first such compilation of early attempts of stove projects at introducing improved stoves was made by Caceres (1984; see Table 1))
This table has been upgraded for a few countries and is shown in Table 2. It is clear that the numbers have grown enormously and by 1992, the Indian figure stood at over 12 million. According to the present author these are adequate signs to suggest that it may be possible to establish a stove industry following the principles of mass production.
Market penetration rate
Most of the stove programmes which are shown in Tables 1 and 2 are heavily subsidized programmes. It is reasonable to assume that the current levels of subsidy might not survive this decade. Thus it seems useful to start thinking now about establishing stove production systems operating on commercial principles. If we take this attitude there is another factor which should be taken into account while planning for the production capacity. It is the market penetration. It is simply foolhardy to assume that the total market will be reached with the installation of the production system. It is important to have some idea about this since some form of bank loan will be essential to start our hypothetical factory. Banks, those bastions of conservative thinking, would like to know how the production capacity was arrived at.
There is so little data on this subject in developing countries. Even in
industrialized countries the data and expertise on this subject are firmly
in the hands of large multi-national corporations. Thus it is not simple to
piece together a coherent picture of the market penetration rates for
different classes of products. An interesting work on this subject is due to
Marchetti on the automobiles (1983). The work examines the evolution of car
population , i.e. the number of cars on the road.
| Population (x106) | Stove market in 2000(x106) | |||||||
| Sl. No. |
Country | Total | Urban | Maximum | Urban | Probable | ||
| 1982 | 2000 | 1982 | 2000 | |||||
| SAHEL | ||||||||
| 1. | Chad | 4.6 | 7 | 0.87 | 1.9 | 1.0 | 0.27 | 0.45 |
| 2. | Mali | 7.0 | 12 | 1.33 | 1.6 | 1.7 | 0.35 | 0.77 |
| 3. | Burkina Faso |
6.5 | 10 | 0.71 | 1.6 | 1.4 | 0.21 | 0.64 |
| 4. | Niger | 5.9 | 11 | 0.83 | 2.2 | 1.6 | 0.37 | 0.71 |
| 5. | Senegal | 6.0 | 10 | 2.04 | 3.5 | 1.4 | 0.44 | 0.64 |
| 6. | Sudan | 20.2 | 34 | 4.65 | 10.3 | 4.9 | 1.3 | 2.2 |
| EAST AFRICA | ||||||||
| 7. | Ethiopia | 32.9 | 57 | 4.93 | 11.0 | 8.1 | 1.4 | 3.6 |
| 8. | Malawi | 6.5 | 12 | 0.65 | 1.6 | 1.7 | 0.26 | 0.76 |
| 9. | Rwanda | 5.5 | 11 | 0 27 | 0.62 | 1.6 | 0.08 | 0.72 |
| 10. | Burundi | 4.3 | 7 | 0.09 | 0.25 | 1.0 | 0.02 | 0.45 |
| 11. | Uganda | 13.5 | 25 | 1.21 | 2.2 | 3.6 | 0.27 | 1.6 |
| 12. | Tanzania | 19.8 | 36 | 2.57 | 7.9 | 5.1 | 1.0 | 2.3 |
| 13. | Kenya | 18.1 | 40 | 2.71 | 7.8 | 5.7 | 0.98 | 2.6 |
| Sl. |
Country | Year inititated |
Materials/types | Number built |
| 1. | Guatemala | 1977 | mud massive | 7000 |
| 2. | Indonesia | 1978 | mud light | 3400 |
| ceramic liner | 6000 | |||
| 3. | Sri Lanka | '' | mud + ceramic | 2140 |
| ceramic liner | 4000 | |||
| 4. | Burkina Faso | '' | brick + cement | 4000 |
| 5. | Nepal | '' | mud light | 1200 |
| ceramic liner | 5300 | |||
| 6. | Niger | 1979 | mud | 1000 |
| 7. | Senegal | 1980 | mud small | 5000 |
| 8. | Ethiopia | '' | pressed mud | 2000 |
| 9. | Kenya | 1981 | mud ceramic | 1000 |
| metal + ceramic | 5000 | |||
| 10. | Mali | 1981 | mud | 1000 |
| Country | Year | Number |
| China
|
1991 | 148x10
|
| India
|
1992 | 12x10
|
| Sri Lanka
|
1991 | 0.43x10
|
| Nepal
|
1991 | 40,000 |
| Kenya
|
1989 | 0.55x10
|
| Rwanda
|
1990 | 20,000 |
| Zimbabwe
|
1989 | 10,880 |
| Burkina Faso
|
1987 | 0.3x10
|
| Niger
|
1987 | 90,000 |
| Senegal
|
1987 | 40,000 |
(1991);
The latter is represented as a function of three parameters describing the
localization of the processes in time, the rate of the process and the
saturation level. The results of his work are tabulated in Table 4.
| Sl. | Country | Saturation | 50% penetration | Time |
| No. | level(x10
|
date | const. yrs | |
| 1 | United States | 200 | 1977 | 79 |
| 2 | Canada | 20 | 1979 | 58 |
| 3 | Sweden | 4 | 1965 | 47 |
| 4 | Austria | 3.2 | 1978 | 36 |
| 5 | United Kingdom | 17 | 1965 | 30 |
| 6 | France | 20 | 1967 | 30 |
| 7 | West Germany | 19 | 1965 | 21 |
| 8 | Italy | 20 | 1970 | 22 |
| 9 | Japan | 21 | 1971 | 12 |
A sobering revelation of this analysis, in the words of Marchetti is: The launching of new models, introducing new tricks, and slashing prices, is of no consequence in the determination of owning a car, which seems to follow a perfect path, controlled perhaps by the usage values of the car that are not influenced greatly by a new shape or new bumpers''. In essence Marchetti assumes that ``there is a pool of good ideas in manufacturing, product design and advertising that are dormant and are picked up by and used when (and only when!) there is a menace of falling behind the perceived path''. And finally as far as the competition among the different competitors is concerned, Marchetti quotes Red Queen saying to Alice, ``Now here you see, it takes all the running you can do to keep in the same place''. (Emphasis is from Marchetti's paper).
There is a nagging doubt whether the growth behaviour of such a large, complicated and expensive product like an automobile has any relevance to a small, simple and cheap product like a stove. One could counter this argument by looking at information over
household appliances. Information on the penetration rates for such appliances is meagre and what is available is reproduced in Table 5, taken from Schipper and Ketoff (1982). The table gives the percentage saturation level and the date on which it was reached for several household appliances in six countries. However there was no information given in the original reference on the absolute values of saturation levels nor on the rate of growth of population of the appliances. It is possible to infer the former from the number occupying a dwelling (given by Schipper and Ketoff) and the population figures (which can be obtained from the ``World Development Report'' published annually by the World Bank). This is how the table has been prepared.
A few observations on this table are in order. The saturation limit has been taken to be the total number of households. This is nearly true for the refrigerators, plausible for the clothes washers and to be doubted for dish-washers. For Bangkok the approach is to be doubted; the survey was based on families that had children enrolled in secondary schools. If time-series data were available, then one could have obtained the three parameter logistic of Marchetti. A second observation is connected with dates corresponding to the attainment of saturation levels. If we assume that before the Second World War very few families had refrigerators and if we put 1947 as the commencement date of reconstruction, it has taken 33 years to approach the 95of saturation. The final observation pertains to the size of the market for these products. They are at least an order of magnitude larger than the total expected market for stoves in many African countries (see later).
In spite of the question of relevance of the above line of thinking for stoves, a number of lessons can be drawn from this experience that can be used with profit for planning production systems for stoves. Firstly, the rate of market penetration of household appliances need to be measured in decades (i.e. moving from 10 to 90the data in the Tables 4 and 5 pertain for most parts to the years after 1945 - a period in which the presently industrialized nations enjoyed an unprecedented economic growth. This growth was fueled by an industrial and commercial system that was nearly in place, the ubiquitous hire-purchase system that encouraged the population to use the technology and the last but not the least cheap energy. None of these factors have operated in the developing countries since 1977 - the date of commencement of of the stove projects on an international scale. As a matter of fact the stove programme of the Government of India began in earnest only in 1983. Thus the expectations placed on these programmes was more of a hope than a reasoned argument.
Secondly the Marchetti ecologically deterministic model to be applicable for
the present problem needs another parameter added to it - a parameter that
accounts for the overall climate of economic growth. The biological example
that supports this line of thinking is that it is not easy to visualize the
duplication of diversity and extent of species prevalent in a tropical rain
forest, say in the region above the arctic circle in a natural manner. This
is the essence of the appropriate technologists' argument. However sound
this argument maybe, the greatest good can come through only by creating a
pool of good ideas in manufacturing, product design, and advertising.
Moreover the whole field of work is threatened with extinction if one
restricts oneself ``to life at lower levels'' that have extremely short life
cycles. The whole business requires the support of some giant trees to
retain its identity and perhaps even survival. Thus the arguments about
``small is beautiful'' and thus small local projects will come to nothing in
the final analysis.
| Sl. No. |
Country | Refrigerator | Clothes washer | ||||
| Level % |
Number 106 |
Year | Level % |
Number 106 |
Year | ||
| 1. | France | 95 | 17.7 | 1980 | 73 | 13.6 | 1989 |
| 2. | Italy | 94 | 15.5 | 1980 | 75 | 12.4 | 1980 |
| 3. | Sweden | 95 | 3.4 | 1979 | 80 | 2.9 | 1979 |
| 4. | U.S.A. | 100 | 82 | 1978 | 80 | 66 | 1978 |
| 5. | Taiwan | 85 | - | 1978/9 | - | - | - |
| 6. | Bangkok | 82 | - | 1980 | - | - | - |
| Dish-washer | Electric rice cooker | ||||||
| Level % |
Number 106 |
Year | Level % |
Number 106 |
Year | ||
| 1. | France | 22 | 4.1 | 1980 | - | - | - |
| 2. | Italy | 10 | 1.6 | 1980 | - | - | - |
| 3. | Sweden | 17 | 0.61 | 1979 | - | - | - |
| 4. | U.S.A. | 50 | 41 | 1978 | - | - | - |
| 5. | Taiwan | - | - | 90 | - | 1979 | |
| 6. | Bangkok | - | - | 84 | - | 1980 | |
Notes: (a)Number corresponds to saturation level percentage (deduced
from the
original data of Schipper and Ketoff)
(b)Average family sizes in Taiwan and Bangkok was not available and hence
number could not be calculated.
(c)* Bangkok is the only city in Thailand where the survey was done.
(d)Source: Schipper and Ketoff (1982)
Finally it is necessary to take note of Red Queen's advice to Alice: we need to explore other avenues and that too rapidly.
There is one more question that needs to be considered before leaving this topic of market penetration. How will the future energy market evolve? There are some attempts being made to provide kerosene and LPG for the totality of the urban population. This will have a significant impact on saving of forests. There is not much serious work in this area. The only work that the author has come across is a statement of objectives for stove programmes provided by Madon & Matly (1986) (quoted in Bussmann 1988) for the city of Niamey in Niger. Table 6 shows these objectives. The table takes into account of the fact that most households in developing countries have provisions for a second source of fuel to guard against the supply uncertainty. The table echoes the earlier sentiment that at the end of 10 years of stove sales efforts there will be still over 50% of the households relying upon the wood fuel and over 15% relying on traditional Malgache stove.
Product life expectancy
Moving back to fig.1, we can look at the problem of stove population build
up from another angle which has a significant influence on the stove design.
| Households | Market penetration | ||
| 5 years % |
10 years % |
||
| Gas | 1 | 4 | 4 |
| 2 | 2.5 | 5 | |
| Kerosene | 1 | 17.5 | 35 |
| 2 | 2.5 | 5 | |
| Imp. stoves | 1 | 25 | 25 |
| 2 | 5 | 10 | |
It is the life expectancy of the product. This can be done in a couple of ways. We shall present both these approaches. The first one is due to Tim Wood (1982). He proposed the concept of half-life for stove populations analogous to the concept in radiation physics. Half-life is defined as the period at the end of which only half of the stoves introduced at the beginning of the period will be in operation. Wood suggested in his paper that no more than 2000 stoves will be in operation at the end of 10 years if 1000 stoves with a half-life of 1 year are installed every year. We shall present a model that explains this process. A variation of this model helps to explain some of the field results from Niger.
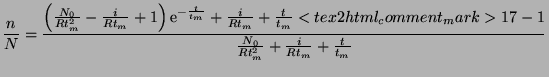
The model calculates the number of stoves, ![]() , in operation at any given
time, t, with as its half-life and i is the rate at which stoves are
introduced. The differential equation governing the problem is given below.
, in operation at any given
time, t, with as its half-life and i is the rate at which stoves are
introduced. The differential equation governing the problem is given below.
 |
(1) |
| with |
(2) |
The solution to this equation is given by
| (3) |
This equation shows that as
![]()
| (4) |
Thus this verifies the earlier statement that you can never reach beyond a population of 2000 stoves if your introduction rate is 1000 stoves per year and the half-life of the stoves is one year. We plot the result of Eq. (9.3) for three cases in figure 2 to see the practical implications of this model. The intention is to
reach a target of 10,000 stoves in operation at the end of 5 years. Case (a) shows a design with a half-life of one year and the introduction rate of 2,000 per year. It is obvious that this will never be reached from Eq.(9.4); the curve shows a little more. At the end of 5 years even this limit is not reached - the number of stoves is something like 3500. This could be thought of as either poor production planning or the designer did not take care of the point about life expectancy of the product.
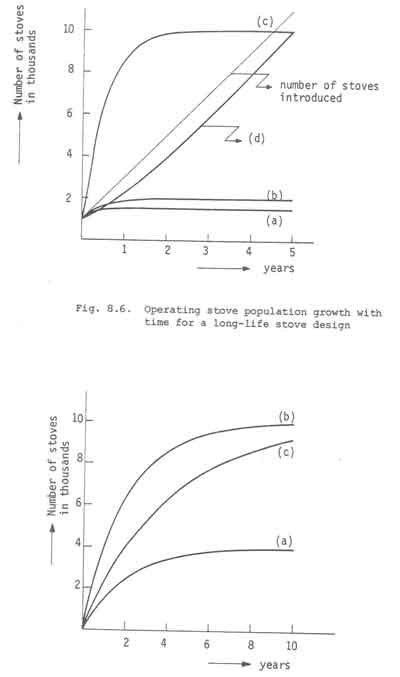
Fig.2. Growth of stove population for a short-life design
Case (b) shows that if the rate of introduction is increased to 5,000 stoves per year, 92% of the target is reached at the end of 5 years. In other words one needs to plan for a much larger production capacity; that sounds like the Red Queen. Case (c) shows, with a stove half-life of 2 years and an introduction rate of 2,500 stoves per year, that at the end of 5 years about two-thirds of the target is reached; it takes 10 years to reach 92% of the target. There is another point here: the design has to be superior in terms of the materials which invariably demands more sophisticated production techniques. This discussion essentially provides insights into the need for considering the issue of life expectancy and its intimate relationship with design and manufacturing.
Bussmann (1988) used a variation of this formulation and checked it against some field data. His model calculates the probability (p) of a stove remaining in use at any given time after its first operation.
 |
(5) |
| (6) |
The solution of this equation is
| (7) |
The model was tested against the life-expectancy of the traditional Malgache stove which is a commonly used metal stove made out of recycled material by artisanal labour. Figure 3 shows a sketch of the stove and Table 7 summarizes some principal characteristics and cost of the stove.
Figure 4 presents the percentage of the traditional Malgache stoves out
of order, i.e. ![]() , as a function of time as obtained from Eq.(9.7)
and compares with some field data from the city of Niamey in Niger.
, as a function of time as obtained from Eq.(9.7)
and compares with some field data from the city of Niamey in Niger.
It is easy to infer from the figure that the half-life of these stoves is of the order of 6 months. In other words these relatively simple models suggest to the designer what he should be aiming for with the designs of improved stove designs.
In the foregoing discussion it has been assumed that a user buys the stove
and s/he does not need to do anything special to look after it. Over a
period of time the stove performance starts deteriorating and at some point
the user will have to either buy a replacement or make do without its
services. This expresses a simple fact of life: all systems - natural or
man-made - show a deterioration in performance with use and/or time. The
useful life of a man-made device is dependant on many factors like: its
design; the materials used in, and the method of, manufacture; and the care
with which it is operated.
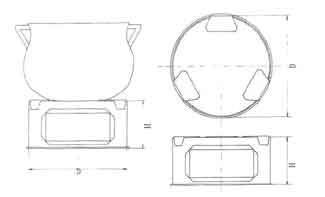
Fig.3. Life expectancy of the traditional Malgache stove.
In addition periodic maintenance by way of repair of defective components and/or replacement of broken down components is essential for a device to give its expected performance during its life. Aircraft, motor cars, wind mills, radios and even buildings - all show this tendency in their overall behaviour. Stoves are no different in this sense.
In terms of the half-life concept this idea of maintenance can be roughly stated to extend this half-life. Stoves do show deterioration in performance due to damaged pan seats (especially those made out of mud), blocked passages and chimneys, broken down dampers and grates, damaged fire boxes due to careless loading of wood, formation of cracks on the stove body, etc., etc.. The extent of deterioration and the speed with which the deterioration sets in are determined by the design, manufacture and care in operation.
Figure 5 shows schematic sketches adapted from Narasimha & Ananthasayanam (1979) indicating the overall performance of two stoves over their useful lives. The two stoves will be called short and long life stoves. The performance indicator chosen for the representation is fuel consumption. One could also use other indicators such as safety or the time required to cook, etc..The useful life of a stove for the purposes of the discussion that follows is taken as the time at which the fuel consumption of the new stove exceeds that of the open fire. Obviously other criteria can be chosen.
Figure 5a shows a situation where it is contemplated that the stoves will need very little or no maintenance attention over their life time. Correspondingly their life times can be expected to be short. In some sense this is equivalent to the throw-away things that the well-to-do of this world use. The Malgache stove we considered above is a representative of this class. As we have already shown, to achieve a given target of stove population a larger production capacity has to be planned. On the other side of the coin it is cheap and there operates some sort of equilibrium between the replacement rate and the production rate. Since we have considered the life time and build up of the stove population already we shall now turn to the second part of the figure.
In fig.5b we show the performance trajectories that one can expect from a hypothetical long life stove for two cases - one without and one with periodic maintenance.
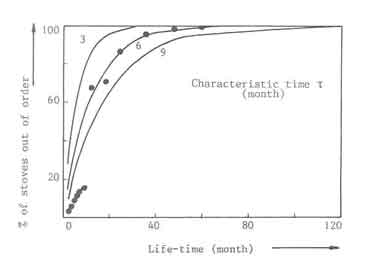
Fig.4. Schematic sketches showing the performance of a short
and a long-life stove as a function of time.
(a) Short life stove (The Malgache of Sahel)
(b) Long life stove (ASTRA type
The precise trajectories will depend on the design, manufacture, and the use of the stove as can be surmised from the foregoing discussion. A given population of stoves can be expected to exhibit trajectories that differ from one another in a random manner. Thus the trajectories should be thought of as as some average representation of the performance of a whole population of stoves. The purpose of the graph is to illustrate three ideas:
- (a)
- a stove well maintained will show a much longer life time than one that is not maintained at all which is a common experience for most of us;
- (b)
- the mean time interval between two maintenance activities,
 , is much smaller than the total life time,
  ; and
; and - (c)
- the savings in fuel consumption of the stove over that of the open fire integrated over the useful life of the stove will be smaller than the savings that would have resulted if the stove would have operated throughout its life time at the same fuel consumption value as when it was new. Mud stoves like the ASTRA and Lorena would roughly show this behaviour.
This has an important message for the designer and the manufacturer - it is essential to work out a clear schedule of maintenance and inform the customer about it. This essentially implies that the design-manufacturer team should periodically evaluate how well their new product is faring with the user. Such a procedure will also assist the team to continuously upgrade their product.
It is not the intention here to provide a maintenance manual for different classes of stoves. The intention is to construct a model that predicts the growth of stove population with the stipulation that a proper form of maintenance is available to the user either through a trained stove technician or through an easy-to-follow instruction manual (the latter is probably too much to expect since a majority of the mud stove users may be illiterate; other avenues in this connection need to be explored).
The model presented below follows the work of Rama Prasad on hand pumps
(1980). The governing equation for the number of stoves in operation, ![]() at
any given time,
at
any given time, ![]() , is given by
, is given by
| (8) |
| where |
mean time between two maintenance activities |
(9) | |
| rate of introduction of new stoves per year |
(10) | ||
| number of maintenance activities per year. |
(11) | ||
| (12) |
which is equivalent to saying that at the start of the period there were ![]() stoves in operation. The solution to Eq. (9.8) with the initial
condition prescribed by Eq.(9.9) is
stoves in operation. The solution to Eq. (9.8) with the initial
condition prescribed by Eq.(9.9) is
| (13) |
The steady state population of operational stoves ![]() , is given by taking
the limit of Eq.(9.10) as
, is given by taking
the limit of Eq.(9.10) as
![]() .
.
| (14) |
Figure 6 presents results of calculations using Eq.(9.10). Assuming that
our prototype model here is a mud stove being propagated by a Government
agency operating, let us say in a group of villages. The intention is to
introduce 10,000 in 5 years. The introduction rate is set to be 2,000 stoves
per year. Curve (I) represents the total number of stoves from the start of
the project; it simply increases linearly. Curve (a) shows the case for ![]() =1/4 year and
=1/4 year and ![]() = 4,000 per year. The curve shows that the total number of
stoves in operation steadies itself at a value of 1,350 at the end of two
years.
= 4,000 per year. The curve shows that the total number of
stoves in operation steadies itself at a value of 1,350 at the end of two
years.
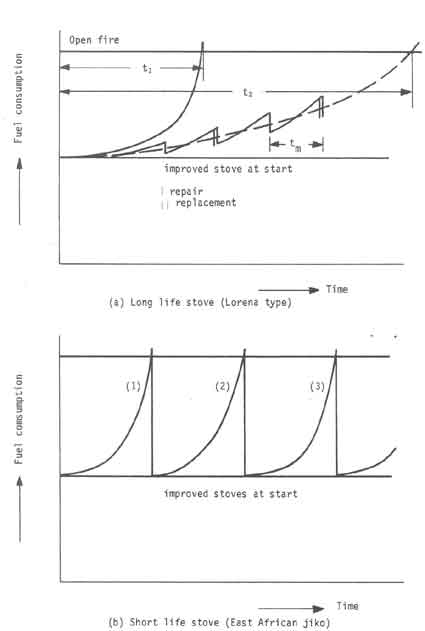
Fig.5. Operating stove population growth with time for a long-life stove design
6 Thus the situation is that, at the end of two years the number of stoves in actual operation is smaller than the number of stoves being installed each year. In particular, the proportion of stoves in operation at the end of 5 years is just 13.5% of the total number of stoves installed. If this is treated as a welfare project, the intention and budgets were based on a calculation for helping 10,000 families; but in the event only 13.5% got helped. If this sounds very much like an average government project, the intention is to suggest that there are relatively simple homework which leads to intelligent guesses about the likely outcome of such a project.
The question is: what went wrong? There are several things that went wrong. Most glaring was that the maintenance force required to keep all the stoves in operation was totally inadequate. A second thing that went wrong was the simple arithmetic that 2,000 multiplied by 5 is 10,000 is far too naive to work. Of course from the design/production viewpoint the stove was too flimsy if it required that level of attention.
The designer returns to the drawing board and remakes the design with tm increased to 1/2 a year. A better engineered design is available; inevitably the cost is higher. To compensate for the higher initial cost the maintenance force is reduced to provide 2,000 operations per year. Curve (b) illustrates the growth of the stove population for this situation. The figure shows that in comparison with the final goal the situation is only marginally better in the sense only 2,000 stoves are in operation at the end of the five year period.
How can we do better? We turn to Eq.(9.11). We can use this equation in one
of two ways. The first way is to ask how much maintenance is required to
achieve the goal given that ![]() = 1/2 year and
= 1/2 year and ![]() = 2,000.
= 2,000. ![]() is then
18,000 per year. The result is shown in curve (c). It is obvious to see that
for most of the time there are not enough stoves (comparing
is then
18,000 per year. The result is shown in curve (c). It is obvious to see that
for most of the time there are not enough stoves (comparing ![]() and
and ![]() ) for
the maintenance force to keep busy. Thus we have a situation which may be
termed maintenance overkill and as such a waste of resources.
) for
the maintenance force to keep busy. Thus we have a situation which may be
termed maintenance overkill and as such a waste of resources.
The second way is to calculate i with r and tm held at 2,000/year and 1/2
year. It is easy to see that i turns out to be 18,000 stoves per year. What
this means is that we have to build 90,000 stoves in the five year period to
have 10,000 stoves in operation at the end of five period. Again there is a
phenomenal waste of resources. The answer to the problem lies in letting the
maintenance force grow with the population of stoves. This can be done by
postulating a full maintenance model by requiring ![]() . This means that
the right hand side of Eq.(9.8) is no longer a constant but a function of
time. The solution of such a modified Eq.(9.8) is given by
. This means that
the right hand side of Eq.(9.8) is no longer a constant but a function of
time. The solution of such a modified Eq.(9.8) is given by
 |
(15) |
As
![]() , with
, with ![]() , the initial number of stoves taken
as zero, the rate of growth of maintenance operations is
, the initial number of stoves taken
as zero, the rate of growth of maintenance operations is
 |
(16) |
Eq.(9.12) is plotted as curve (d) in Fig.(6). It reaches the requisite level of stove population in the period under consideration.
Cost of a stove
This is one of the great imponderables in the whole of stove business. The reasons for this are many. The majority of the stove projects have received massive subsidies from the tax payers' money. The subsidy is a vexing question. Much has been written on this subject. At any rate the biggest push for the subsidy arises from the deforestation angle. It is undeniable that it costs much more to grow trees than to invest in stoves. Since most forestry projects are also tax supported, the argument goes that it is cost-effective to subsidize stoves. The many pitfalls in this argument have already been alluded to in the introduction to this book. Nothing is gained by repeating it. Thus we shall keep our remarks short and general.
Any good cost accounting of a product needs to include all the elements that go to make up the cost. These elements are: material, labour, tooling, design and development, marketing ( or to use the other common word used in this connection - extension) and profit for the entrepreneur. The stove business nowhere in the world has reached this level of clear calculation. The projects that involve metal/ceramic stoves tend to charge for the cost of labour, materials and the retailer's mark up. The in-situ built mud stove in most cases is a give-away.
An interesting question as far as the cost is concerned is the ability of the prospective client to pay. A survey was conducted in some rural/semi rural areas of the state of Himachal Pradesh in India on this aspect by Development Alternatives to determine the price elasticity of stove demand (Gusain 1990). The results of this survey are shown in Fig. 6. The interesting feature of these results is the sharp cutoff at one price-level. This level is around 65 Indian Rupees for a three month pay back cycle. Apart from this there is a seasonal buying habit of people that suggests with considerable marketing campaigns one could expect reasonable prices from the clientele as was discovered in Niger (see Fig.7).
Due to the many uncertainties involved we shall desist from quoting stove costs from around the world. There is yet another reason for this attitude.
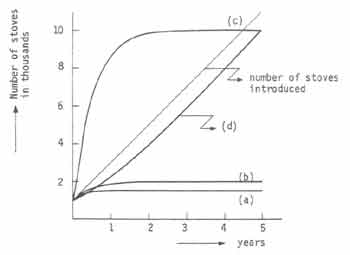
Fig.6. Price elasticity of stove demand. Source: Gusain (1990)
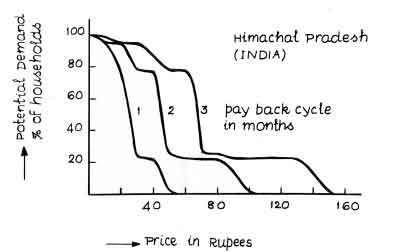
Fig.7. Sales figures of Mai Sauki (a single pan metal stove) in Niamey, Niger. Source: Bussmann
The prices are all given in local currencies and it is extremely difficult to convert this into comparable units. The US$ which the World Bank uses in the opinion of the present author is useless for the stove work.