home
needs
local resources
comfort
safety & health
contact
reports
Power output of a stove
- The material in this section is covered in four parts.
- (i) General Definitions;
- (ii) Phenomonological description of combustion of wood;
- (iii) Time dependent Combustion - open fires; and
- (iv) Time dependent combustion - closed stoves
General Definitions
The power output of a stove is probably the most important design attribute of a stove. The simplest definition of power output is the rate of burning of fuel, ie,
where Mf is the mass of fuel burnt,
B is its calorific value in ![]() and
and
t is the time in seconds.
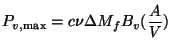
The designer's interest is however is to choose the power output required from the stove. This is determined by the task the stove is expected to perform.For a first approximation we can take the design power to be the same as the maximum power of the stove. It is given by
where Mw is the sum of the amount of water demanded by the recipe and the water equivalent of the food Mfw to be cooked. Mwe is given by
where Mfo is the Mass of food to be cooked,
Cp,fo is the specific heat of the food to be cooked, and
Cp is the specific heat of water.
Tb is the boiling point of water ° C
Ti is the initial temperature of water ° C
![]() is the efficiency and
is the efficiency and
tb is the time to bring the water to boil, seconds.
We have to specify tb, the time to bring Mw kg of water to boil. In principle one of the selling points of a new design could be that it cooks faster. If this is accepted as a starting point, we can state that our design should achieve the performance of a gas burner. The reason for this choice is simple: the Gas Institute in the Netherlands present data on this aspect. We reproduce this in Fig.1 fitted the following power law to the data.
There is yet another class of variables that has a large say in determining the power output of a stove. This concerns the all important fuel angle. We have considered the fuel properties earlier.
The next problem concerns the feeding arrangement. Unless some automatic feeding arrangement is built into the stove (which for all practical purposes is a non-starter), a wood stove can only be operated in a batch mode with all its attendant problems, most important of which is that there is no steady state power.
In order to appreciate the nature of the problem, some familiarity with the process of combustion of wood is helpful.
Phenomonological Description of Combustion of biomass
Combustion is the process by which energy is made available for use in a stove. A prospective designer of stoves has to understand this process to a considerable level of detail. Thus we present here not only thermodynamic aspects which are quite adequate for purposes of high efficiency design but also certain aspects of the actual physics and chemistry associated with combustion. These latter aspects assume great deal of importance for developing designs for clean combustion. The starting point in any study of combustion is a clear description of the chemical and physical properties of the fuel. That has already been done. We start here by providing a phenomonological description of the combustion of wood. The discussion will be in quite some detail.
Fire has been known to man for as many as 600,000 years in its natural form. During most of this time, man's interest has been to keep the fire from dying out. Thus most societies have their form of mythology how fire was discovered or acquired. It was just 30,000 years ago that an ignition source was invented, which permitted a fire to be started at will (Weinberg 1979). Since then man has used fire to cook food, to light and heat his home, to manufacture metallic objects, and finally to produce little mechanical power. Modern combustion theory seems to have its origins in the work of Mallard and Le Chatelier (1883) over a 100 years ago. This also marks the beginning of a strong separatist tendency among theorists and practitioners of combustion. This antagonism still persists and has crept into the cookstove application as well.
Notwithstanding this long history, combustion is still incompletely understood. In particular, wood fires, which probably date back to the invention of ignition, have attracted scientific attention just in the past 30 years or so. The primary interest has been in the unwanted fire (building fires and forest fires), which by its very nature is large in size and destructive in its effect. The work has thus a distinct theoretical flavor to it for the obvious reason that full-scale tests are difficult to plan and carry out (see, for example, Blackshear 1974). Quite a substantial body of knowledge has been accumulated and many reviews have appeared on the subject, the most recent one being that of Emmons and Atreya (1983). In this and succeeding sections we will attempt a description of combustion of wood without any claims on exhaustive coverage.
Two Modes of Operation of Wood Combustion Systems
A general scheme of the different chemical transformations involved in.the burning of pure cellulose, which is a principal constituent of wood, is shown in Fig 2. The other constituents, hemicellulose and lignin, at least in a qualitative sense, are known to exhibit a similar behavior. The figure identifies three distinct parts of the wood-combustion process:
- (i)
- pyrolysis resulting in the liberation of volatiles and the formation of the charry remnant;
- (ii)
- burning of the char; and
- (iii)
- burning of the volatiles.
The course of these processes is to a certain extent influenced by the prior
preparation the wood has received before burning.
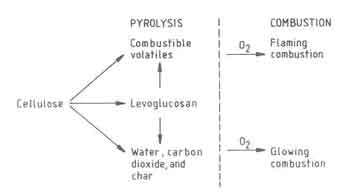
Fig.2. Chemical Transformations in burning Cellulose
Wood is traditionally burnt in large pieces, roughly equivalent to cylinders
of 5-7 cm in diameter and 50-70 cm in length. Figure 2 shows schematically
the processes and corresponding temperatures in such a piece of wood while
it burns (Williams 1974). The figure is a one-dimensional representation but
the real process is multidimensional and time dependent. As the burning
progresses, the top surface regresses and fuel gets consumed. The theory of
combustion has to predict the rate of fuel combustion and the corresponding
rate of heat liberation as a function of the physical conditions under which
the process takes place and the chemical nature of the fuel species.
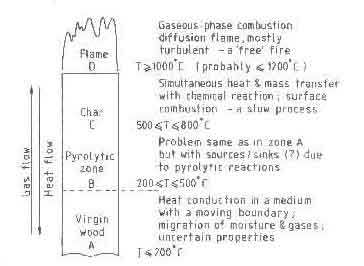
Fig.3. Processes and temperatures in a burning piece of wood
Alternatively, wood burnt either in the form of twigs or prepared small
blocks of wood placed in a heap. This procedure is commonly referred to as
fuelbed combustion in the literature. The process description is somewhat
different and is illustrated in Fig.3 (Voss 1977). However, each piece of
wood undergoes the same set of chemical transformations indicated earlier.
Most closed stoves and industrial furnaces operate in this mode. Yet another
mode of operation is to use pulverized fuel. This is not practical for small
domestic devices that are of interest here.
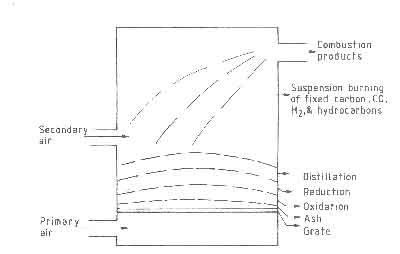
Fig. 4. Processes in a wood fuelbed
Pyrolysis of Wood
As wood is heated in an inert atmosphere, the water (which can be either in absorbed form or in weakly bound intramolecular groups) gets ``boiled off'' at temperatures of 100-110 ° C . The liberation phenomenon occurs in bulk; some of the moisture liberated thus will migrate to the surface and escape to the environment; some will migrate to interior parts of the wood that are cooler and recondenses there. A thick piece of wood may thus have locally higher moisture content during burning than it had before it arrived at the fire.
As temperature is increased chemical decomposition sets in. Hemicellulose decomposes first, between 200 and 260 ° C. Its decomposition products are in a somewhat more oxidized state and are relatively noncombustible. These products also resemble moisture in their migratory behaviour(It is possible to notice moisture and a tarry substance escaping from the nonburning end of a thick piece of burning wood). Cellulose decomposes next at temperatures between 240 and 350 ° C. The scheme of Fig 2 shows the nature of this stage of reaction. Lignin breaks down last at temperatures of 280 ° C or more. The entire process of pyrolysis would be complete at temperatures of about 500 ° C (Murty Kanuri & Blackshear 1970, Roberts 1971, and Williams 1974).
The preceding description suggests that the various reactions occur in
sequence with a certain amount of overlap. This idea has been used to
construct the overall reaction behavior of wood by superposing the results
obtained from studies of individual constituents of wood. The stove
designer's interest in these studies would be to obtain quantitative
information about the relative proportion of heat liberated during the
flaming combustion (i.e., the combustion of volatiles) and the glowing
combustion (i.e., the combustion of char).
| Fuel | Char | Gas | Totalb |
| Cellulose | 4,400 | 12,960 | 17,360 |
| (filter paper) | (25)c | (75) | |
| Douglas fir lignin | 18,300 | 8,360 | 26,660 |
| (Klason) | (68) | (32) | |
| Poplar wood | 6,480 | 12,900 | 19,380 |
| (excelsior) | (33) | (67) | |
| Larch Wood | 8,020 | 11,500 | 19,520 |
| (heartwood) | (41) | (59) | |
| Decomposed Douglas fir | 12,300 | 9,120 | 21,420 |
| (punky wood) | (57) | (43) | |
| Douglas fir bark | 12,600 | 11,300 | 23,900 |
| (whole) | (53) | (47) |
a In kJ/kg of fuel; original data in cal/g have been converted into SI units and rounded to three significant figures.
b Numbers in the last column have been obtained by summation.
c Numbers in the parentheses are the percentages.
Typical results from such studies on the distribution of the heat of
combustion, as determined by methods of thermal evolution analysis
(Shafizadeh and de Groot 1977), of a few forest species are summarized in
Table 1. Apart from the variation shown in Table 1, the physical
conditions of the wood alter the course of pyrolytic reactions. In general,
higher temperature, faster heating rate, and smaller particle size promote
the gasification process and rapid, flaming combustion. On the other hand,
lower temperatures, larger particle size, and the presence of moisture.and
inorganics increase the amount of char, thus favouring glowing combustion
(Shafizadeh and de Groot 1977). Tables 2 and 3, taken from Pyle (1977)
and Zaror and Pyle (1983), show the effect of final pyrolysis temperatures
and moisture content, respectively, on charcoal yield.
| Final Temp. | Charcoal yield | Compostion of charcoal | ||
| (° C) | (% dry wood) | %C | %H | %O |
| 200 | 91.8 | 52.3 | 6.3 | 41.4 |
| 300 | 51.4 | 73.2 | 4.9 | 21.9 |
| 400 | 40.6 | 77.7 | 4.3 | 13.5 |
| 500 | 31.0 | 89.2 | 3.1 | 6.7 |
| 600 | 29.1 | 92.2 | 2.6 | 5.2 |
| 800 | 26.7 | 95.7 | 1.0 | 3.3 |
| 1000 | 26.8 | 96.6 | 0.5 | 2.9 |
| 1100 | 26.1 | 96.4 | 0.4 | - |
| Species | Moisture (%) | Yields as Pyro + tar | % of used Charcoal | wood Gas |
| Oak | 20.6 | 57 | 25.2 | 17.8 |
| Oak | 22.4 | 60 | 27.4 | 12.6 |
| Mixed | 29.0 | 61 | 25.0 | 14.0 |
| Oak | 32.2 | 63 | 22.5 | 14.5 |
| Mixed | 38.8 | 68 | 21.0 | 11.0 |
a Experimental conditions: (1) 9.1 kg charge, (2) 6 hours
pyrolysis, (3) maximum temperature 500 ° C.
It is important to note in this connection that these results have been obtained in pyrolytic conversion units and not from combustion tests. They should be considered as indicative of the extent of effects these different variables can have on the amount of heat that will be liberated by the flaming combustion. We highlight two extremes - 21% is the charcoal yield in the last row of Table 3 and 31% is the yield in the fourth row of Table 3. This, taken along with the overall picture of Table 1, is in contradiction with the earlier statement that moisture tends to favor glowing combustion (the latter is interpreted to mean greater charcoal formation). This type of conflicting information appears to be a recurring theme in any study of wood combustion.
Any combustion study is to be considered unsatisfactory without reference to appropriate chemical kinetic data. The problem is quite complicated not only due to the large number of chemical species present in the volatiles, but also due to the sensitivity of the reactions to the physical conditions under which they take place and the presence of contaminants. Zaror and Pyle (1983) analyzed experimental results on reaction constants in Arrhenius-type equations and showed variations in them by several orders of magnitude. For an idealized description of the pyrolysis kinetics of several artificial and natural materials, see Williams (1974).
A third factor that is important in the development of an adequate theory for combustion of wood is the heat of reaction associated with pyrolysis. The experimental evidence on this again is quite conflicting. In general, an endothermic behavior is exhibited till about 250 ° C (accounted for by the evaporation of moisture and the specific heat of wood). From 250 to 300 ° C, a shallow endothermic to shallow exothermic regime has been observed followed by an exothermic regime. Much of the conflict arises due to the smallness of the effect in the regime 250-350 ° C and due to the behavior of the volatiles during their movement through the pores in the wood.
For further details on pyrolysis studies as well as additional references, the specialized reviews by Browne (1958), Murty Kanury and Blackshear (1970), and Pyle (1977) should be consulted.
Burning of Char
The discussion on the burning of char assumes that the char is mostly carbon and ash. The early work on this subject is described by Thring (1962) as it is applicable to combustion of solid fuel on beds and by Spalding (1955) as it is applicable to the combustion in pulverized fuel systems. The latter will not be useful for the present application because of the orders-of-magnitude difference in particle sizes as well as the combustion intensity involved in the two applications. We shall concentrate here on Thring's description.
The combustion of carbon by oxygen in a solid fuelbed is considered to take place in three stages:
- (i)
- Heterogeneous combustion - oxygen in the air traveling up the
channels in the fuelbed reacts with the solid fuel at its surface according to
 (5)
(5)
- (ii)
- Homogeneous combustion - the CO
migrates into the spaces between particles and reacts with oxygen according to
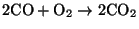 (6)
(6)
- (iii)
- Heterogeneous reduction - CO2
reacts heterogeneously with the carbon surface according to
 (7)
(7)
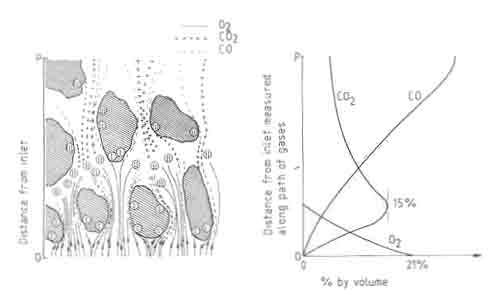
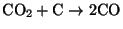
Fig.4. Three stages of combustion on a fuelbed. Composition of air as a function of distance in the fuelbed.
Figure 4, which shows a diagrammatic cross section of a fuelbed, illustrates the three stages of combustion. Gas samples taken at different points in the fuelbed show little CO until the oxygen starts to run out. Typical gas analysis results in a fuelbed are shown in the same figure. This sequence of reactions has an important consequence on the temperature profile. The peak in the temperature is determined by a balance between the heat generation by combustion to CO and CO2 , and heat loss by transport to other parts of the bed. A second consequence of reaction (iii) is that it is responsible for additional removal of carbon over and above that accounted for by the oxidation reactions. Theoretical studies on fuelbeds of carbon particles have been carried out by idealizing the bed to be composed of a series of continuous channels with carbon walls. The interested reader should refer to Thring (1962) and Spalding (1955) for results of such studies.
The stove designer's interest in such studies is twofold:
- (i)
- the rate of fuel consumption; and
- (ii)
- the temperature at the fuelbed surface, which would determine the radiant heat output from the bed.
These are governed not only by the reaction kinetics but also by the aerodynamics of the system. In particular, if a considerable amount of CO escapes from the fuelbed it is essential that the aerodynamics be organized in such a manner as to enable this CO to be burnt on top of the fuelbed.
The Flaming Combustion
Two very different types of combustion can occur for burning the volatiles. It could be a premixed flame, which is essentially what happens in an ordinary household gas stove. The second type is the so-called diffusion flame in which a jet of fuel burns by entraining air from the surroundings without external assistance.
This is the case for the conventional open fire. The appliances we are interested in this work will use the buoyancy force caused by combustion to drive the fluid flow. The chemistry involved in the flaming combustion is far too complex. Over 200 separate components are supposed to be produced by the pyrolysis process. All these may participate in the flaming combustion (Emmons & Atreya 1983). Thus the existing studies on wood combustion tend to lump the chemistry into some tractable form and concentrate on the aerodynamics of the combustion.
Some General Comments
When a piece of wood burns, all three sets of processes occur simultaneously. First there is the feedback from the flame zone to the wood by way of radiation and convection to maintain the pyrolysis process in the wood. This feedback is essential for the sustenance of the fire. This energy is not a loss and will be returned to the fire in full measure by way of pyrolysis products. Second, the char surface.develops cracks and will not look like the flat surface depicted in Fig 2 Third, the volatiles that are generated in the uncharred parts of wood escape through the pores in the wood being pyrolyzed, through pores in the char, and through the cracks to keep the flame going. Fourth, the rather ``homogeneous'' substance we started with will no longer be so during burning. Finally, every fire exhibits an initial build-up phase, a quasi-steady-state phase, and a final decay phase. It may turn out in many cookstove operations that the quasi-steady-state phase may be completely absent. All these factors make the analysis of the total process too complex. The approach is essentially to construct partial solutions to the problems and patch them up in an ad hoc manner with the aid of experiments.
We now present some results from open fires to illustrate the nature of the problem.
The Time-Dependent Burning Process - Open fires
In order to get more information about the burning of wood and the behavior of the fuelbed as a function of time the open fire was operated on a balance. A detailed description of the experimental setup, data acquisition, testing method, and analyses is reported by Visser (1982) and a brief summary of this is provided in elsewhere. In what follows we will restrict ourselves to a presentation of results. The weight-loss recordings are presented in 10 graphs - two for each parameter investigated. These plots show the fuelbed weight as a function of time and the power peak from the volatiles averaged over each experiment (Pv, max). The method of analysis used to obtain the latter information has already been discussed. . Here we also discusses the definitions of nominal power, design power and the maximum volatile power. The reader is advised to review these concepts before starting on the study of the results that follow.
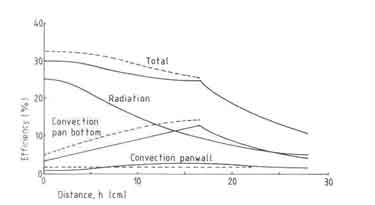
Fig.5. Measured efficiencies of an open fire
The power range of the fire
A factor that is of an enormous significance for the performance of a stove
is the power range it is able to deliver. The importance of this will be
shown. Figure 6a shows the weight of the fuelbed at the end
of each charge interval (see elsewhere for the definition) and 6b shows
Pv, max as a function of power. All the power values in the
figure correspond to the nominal power. It is seen that the fuelbed weight
curve for the open fire with a grate reaches a steady state within the
experimental time of 1 hour only for a nominal power of 5.2kW. This roughly
corresponds to the design power of the fire according to the definitions
given. .
Fig.6. t as a function of time (a) and maximum volatile power as function of nominal power of the fire.
For power levels higher than this the fuelbed continues to build up and a stage will be reached when the grate is too small to hold all the charcoal. The maximum amount of charcoal the grate of diameter 0.18m can hold is about 100g. Adding another 100g of fresh wood will lead to the fuel falling off the grate. In such a case the design becomes non-functional. In the case of a design without grate, an equivalent situation is reached at a power level of 3.1kW. The equivalent of fuel falling off from the grate in the absence of the grate should be thought of as the diameter of the fuel bed becoming higher than 0.18m. For a closed stove this situation can lead to the choking of the combustion chamber leading to poor combustion and a lot of tar deposition on the pan.
The minimum nominal power is found to be 2.6kW irrespective of the presence or absence of a grate. Attempting to operate the fire at powers lower than this will invariably lead to the presence of insufficient amount of burning charcoal to reignite a fresh charge of wood. However one could manage the fire with a smaller diameter and a smaller charge of wood. This was not attempted by Visser. Thus the nominal power of a steadily operating fire with a fuelbed diameter of 0.18m with a grate ranges only from 2.6 to 5.2kW (a turn down ratio of 2). In the absence of a grate, this ratio is only 1.2.
Pv, max, the maximum volatile power, shows a remarkable property of the open fire(see Fig.6b). It is independent of the nominal power; only the frequency of power peaks changes as determined by the refuelling frequency. We will discuss this aspect in greater detail in indoor air quality where we will consider the cleanliness of combustion. The value of Pv, max lies between 5 and 5.5kW for the grate fire and is about 4kW for the fire without a grate. We have pointed out that higher powers can only be obtained by increasing the charge size and not by reducing the charge interval. Thus higher powers in a fire mean that either the peak volatile power is realized for longer periods of time in the charge interval or in every charge not all volatiles are released leading to fuelbed build up. At the present moment it is unclear which of this operates in a real fire. Thus we use the following rule of thumb, originally given by Bussmann (1988) in a slightly different form, for the design power of a stove.
where Pmax should be thought of as the maximum power a stove configuration is able to deliver without any restriction on the quality of combustion.
Armed with the observations on the fuelbed and Pvmax behaviour, we can construct reasons for the absence of any effect of nominal power on the efficiency (see Fig.5.). This is primarily due to the fact that the fuelbed-pan distance as well as Pv, max do not change for nominal powers in the range 2.6 and 5.2kW. Thus the convective and radiative heat transfers to the pan do not change very much. For nominal powers higher than 6kW the radiative heat transfer can be expected to increase by virtue of increase in the fuel bed thickness; in fact the fuelbed attains the shape of a cone. However this increase does not show up in the measured efficiencies.
The wood species
It is customary to claim that the efficiency of a stove strongly depends on the wood species used. It is also stated that heavy tropical hard woods burn very differently from a species such as the light white fir used in many open fire experiments in Eindhoven. This idea is used to explain away the observation that field measurements tend to have very much lower efficiencies (eg. Joseph 1979). But the experimental results shown in Fig.5 do not confirm this opinion. The effect of varying wood species has only a marginal effect on the efficiency. An important point in this connection is the method one uses to characterize wood species. Here we shall satisfy ourselves by presenting some information about the properties of wood used in these investigations (see Table 5.5). It is clear that there is no property in the list which recommends itself for a clear description of the wood species. Since wood density has a fairly important effect on closed stove design and operation, it has been chosen to represent the wood species effect on the efficiency.
Figure 7 shows the effect of wood species on fuelbed weight and the
maximum volatile power. Both these parameters are strongly affected by the
wood species.
| Species | Combustion value |
|||||
| Botanical name | Common name | Density kg/m3 |
Volatile fraction |
Charcoal fraction |
Lower (MJ/kg) |
Volatile (MJ/kg) |
| Picea abies | White fir | 410 | 0.800 | 0.200 | 18.7 | 15.2 |
| Dyera constulata | Jelatong | 440 | 0.828 | 0.168 | 17.8 | 14.8 |
| Chlorophora regia | Iroko | 580 | 0.796 | 0.187 | 18.1 | 15.0 |
| Shorea | Meranti | 600 | 0.781 | 0.219 | 18.3 | 14.2 |
| Quercus robus | Oak | 620 | 0.829 | 0.169 | 16.9 | 13.7 |
| Fagus sylvatica | Beech | 650 | 0.845 | 0.152 | 17.0 | 14.2 |
| Intsia bijuga | Merbau | 850 | 0.784 | 0.214 | 18.1 | 14.1 |
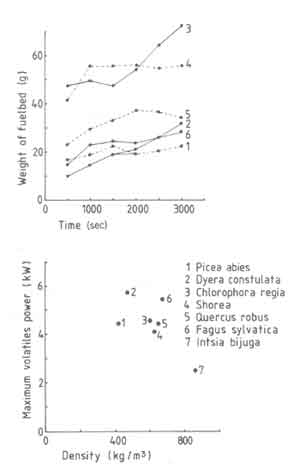
Fig.7. t as a function of time (a) and maximum volatile power (b) as a function of wood species
The results do not correlate with either the wood density or the volatiles content. Existing literature does not help either. For example Emmons (1980) suggests that this situation is to be expected in view of the inadequacy of the current theories of the pyrolysis process. However in order to get some insight into the process we will use a rather simple model proposed by Verhaart (1983). Verhaart uses the concept of fire penetration rate defined as the rate at which the char boundary advances into the virgin wood. This has the dimensions of the velocity. In principle the fire penetration rate depends on the heat and mass transfer processes in the virgin wood and on other parameters such as moisture content and the wood species. Verhaart simplified the problem by assuming this rate to be constant. This assumption has been made in other studies on pyrolysis as well (see for example Eq.(4.24) . If this constant is known, one can use a formula of the following type (Bussmann 1988) to obtain Pv, max.
 (9)
(9)
where ![]() is the fire penetration rate, m/s
is the fire penetration rate, m/s
![]() is the volatile fraction in wood
is the volatile fraction in wood
![]() is the charge weight, kg
is the charge weight, kg
Bv is the calorific value of volatiles
A is the surface area of the wood pieces used and
V is the volume of the wood pieces used.
This formula essentially assumes that there is a period of burning over
which Pv, max is constant. While the open fire experiments
rarely showed such behaviour, we will later present some results
that shows such a trend. This formula was used to estimate the fire
penetration rate for the experiments with different wood species considered
in Fig. 6. The results are shown in Table 5.
| Botanical name |
Common name |
Density kg/m3 |
P (Kw) |
w (mm/s) |
| Picea abies | White fir | 400 | 5.1 | 0.019 |
| Dyera constulata | Jelatong | 440 | 6.1 | 0.022 |
| Chlorophora regia | Iroko | 580 | 4.9 | 0.018 |
| Shorea | Meranti | 600 | 4.7 | 0.018 |
| Quercus robus | Oak | 620 | 5.0 | 0.019 |
| Fagus sylvatica | Beech | 650 | 6.1 | 0.022 |
| Intsia bijuga | Merbau | 850 | 3.4 | 0.013 |
The table shows that the fire penetration rate generally reduces with increasing density of wood, a conclusion that is obvious from Eq.(5.34) and Fig.7. The scatter in both sets of information is about the same. Thus if we omit the data point for merbau one could take the fire penetration rate as being constant at 0.20mm/s. We shall provide additional experimental data on fire penetration rate variation with respect to wood size later.
The moisture content
Oven-dry wood is preferred for laboratory work to permit comparison among different experiments. However wood is rarely used in this manner in practice. Again one hears claims that the efficiency is strongly dependent on the moisture content of the wood (Evans 1981). It is obvious from our discussion in x4.2 that moisture in a given piece of wood has a strong influence on the net heat available from that piece of wood. However if we correct the calorific value for the presence of moisture, then according to the efficiency results in Fig.5, moisture content has very little influence on the efficiency. In these experiments a desired level of moisture content in the wood was obtained by adding a calculated quantity of water to the oven-dry wood. The mixture was allowed to stand in a sealed container for a few days. The weight of the charges was appropriately increased so that dry wood in the moist sample was held at 100g.
The fuelbed weight and Pv, max results are shown in Fig. 8. It is seen from the fuelbed weight figure that the fire goes through two distinct stages. In the initial phase the fire after being lit burns very slowly and thus a fuelbed is built up.
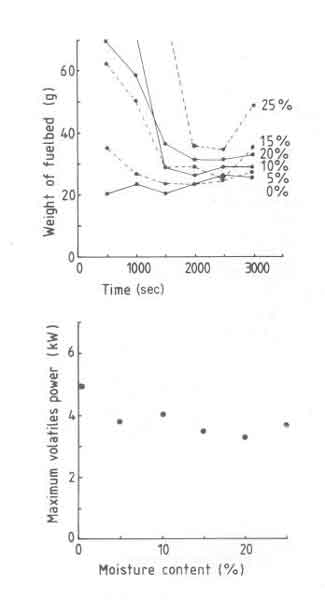
Fig.8. t as a function of time (a) and maximum volatile power (b) as a function of moisture content.
The level of moisture content determines the duration of the initial phase and the maximum weight of the fuelbed. Once this phase is over the fuelbed is hot enough to evaporate all the moisture without any difficulty. The second phase thus resembles for all practical purposes the behaviour of a dry wood fire.
In general the fire behaviour is erratic. For example the fuelbed weight curve for 10% moisture does not follow the general trend of the rest of the data. This is attributed to the fact that the lighting procedure strongly determines the course of events in the first stage described. Though in these experiments a standardized procedure was used for lighting the fire, apparently events that follow are strongly sensitive to small changes in the procedure which are inevitable in any experimental situation.
There is a strong drop in Pv, max (35%) when the moisture content is changed from 0 to 5%. Thereafter Pv, max becomes nearly constant at about 3.5kW. In other words in spite of the precautions in charging procedures the volatile power reduces. The design power thus falls down and was found for the grate used to be 3.5kW. Thus the power density drops from 22 to 14 W/cm2. The above results can be used to explain the efficiency results while using the moist wood. Since Pvmax is a weak function of moisture content (except for the sharp increase in the range 0 - 5%), convective heat transfer will change very little. Further the fuelbed thickness also varies very little (variation in weight between 40 and 50g), there can be very little change in radiant heat transfer. Accordingly efficiency changes very little.
The size of wood blocks
The influence of the size of the wood blocks on the fire behavior is the
last fuel parameter to be examined. Again the results available do not agree
with each other - this time however, these are laboratory results. Sielcken
and Nieuwvelt (1981) reported that the efficiency of the Family Cooker (a
closed light-weight metal stove with two pans) increased nearly three-fold
when the volume to surface area ratio was increased from 2 to 6. On the
other hand the results of Nievergeld et al. (1981) on the Delepeleire - van
Daele stove (again a closed light weight metal stove with two pans) show no
significant influence of wood block size (in the same range) on efficiency.
The efficiencies of the open fire as a function of wood block size are
tabulated in Table 6 and show no influence of the wood block size on
efficiency.
| Size of wood blocks (mmxmmxmm) |
(mm) |
Efficiency (%) |
Pv, max (Kw) |
Fuelbed weight (g) |
w mm/s() |
| (mm) | (g) | ||||
| 15 x 15 x 50 | 3.26 | 25.9 | 6.28 | 20 | 0.017 |
| 20 x 20 x 67 | 4.35 | 26.4 | 5.13 | 27 | 0.018 |
| 32 x 32 x111 | 6.99 | 25.7 | 4.04 | 55 | 0.019 |
The table also shows the rather strong influence of the size of the wood blocks on Pvmax and the build-up of the fuelbed. The fire penetration model of Eq.(5.34) was used to calculate the fire penetration rates. The results are consistent with what one would expect. These results suggest that concepts such as bundling little twigs and cutting large pieces of wood have very little to do with efficiency. These concepts are likely to affect the regulation of the fire. Needless to say these results have been obtained in careful laboratory experiments and such care is too much to expect in a rural kitchen.
There is another aspect to fuelbed build-up and is shown in Fig.9. The figure is for an experiment with a high power of 10kW (larger grate area) and clearly shows the thicker fuelbed for larger pieces of wood. The "steady state" fuelbed weight is attained much later with the large blocks of wood compared to the smaller ones.
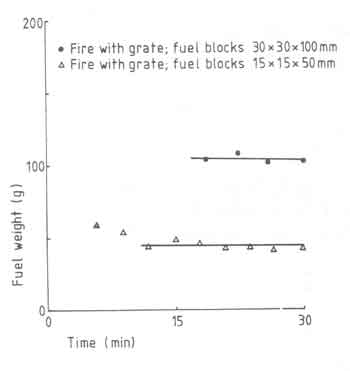
Fig.9. Fuelbed weight versus time for different woodblock sizes
The position of the pan
We have shown while discussing the efficiency results that the distance between the pan and the fuelbed is the one parameter that has an enormous effect on the efficiency of the open fire. The maximum efficiency in this series of experiments was recorded with the lowest distance between the pan and the fuelbed as has already been pointed out. What is more this efficiency, at 36%, is greater than the efficiencies that have been measured with many an improved stove.
We shall now turn to the weight-loss results for these experiments (see Fig.10).
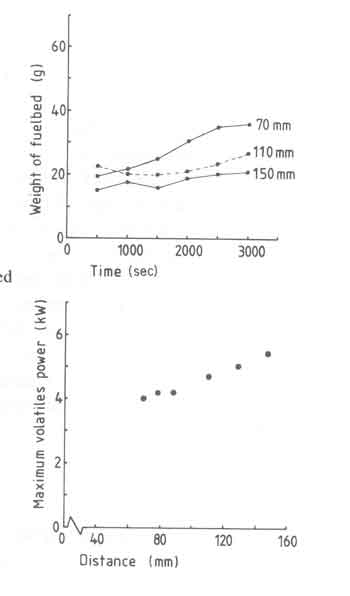
Fig.10. t versus time for different woodblock sizes.
Fig.10(a) shows that the pan-fuelbed distance does not have that strong an
influence on the fuelbed weight. In spite of this, it seems useful to
remember that small changes in fuelbed thickness can have a relatively large
effect on the heat transfer properties at small pan-fuelbed distances. In
the efficiency graph the pan-fuelbed distance (
![]() )
has always been measured from the grate or the bottom of the fuelbed. For small
)
has always been measured from the grate or the bottom of the fuelbed. For small
![]() it is important to correct it for the fuelbed thickness while calculating heat
transfer to the pan. Bussmann (1988) provided the following empirical
relation between the fuelbed thickness
it is important to correct it for the fuelbed thickness while calculating heat
transfer to the pan. Bussmann (1988) provided the following empirical
relation between the fuelbed thickness
![]() , and
, and
![]() :
:
where
Figure 10(b) shows the influence of pan-fuelbed distance on Pv, max . It is quite significant; as a matter of fact it is comparable with the change in efficiency. This is quite exceptional if we recall that the nominal power had so little influence on Pv, max. This seems to suggest that a lower power from the fire can be achieved by simply reducing the pan-fuelbed distance. If this can be accompanied by smaller charges of wood, it will provide a means of controlling the power output of a fire.
In Fig.5.12 we have compared the experimental result on efficiency as a function of pan-fuelbed distance with theory. However that result did not explicitly show the dependence of Pvmax on pan-fuelbed distance. In what follows we shall provide a simple-minded model that can explain this latter effect. We start out with the assumption that there is a feedback mechanism between the flames and unburnt wood. This feedback mechanism is principally the radiant heat transfer between the flames and the wood and has been tested for wood cribs (Williams 1975). Convective heat transfer is important only for fires with fuelbed diameters smaller than 100mm diameter (De Ris 1978). The radiation originates both from the burning embers and the flames. We shall consider only the latter and can be estimated from a simple procedure given by Modak (1977) and Orlof (1981). The procedure assumes a homogeneous and isothermal flame. The total radiation from such a flame is given by
The constant ![]() for wood is 0.8
for wood is 0.8 ![]() (Yuen & Tien 1975).
(Yuen & Tien 1975).
![]() ,
the mean geometric beam length (a concept we used in 5.3) is
,
the mean geometric beam length (a concept we used in 5.3) is
 (12)
(12)
For the small wood fires this equation shows that
![]() will be of
the order of
will be of
the order of
![]() .
Thus for such flames we can approximate the expression (5.36) by
.
Thus for such flames we can approximate the expression (5.36) by
The radiant heat captured by the fuelbed can be calculated by
 (14)
(14)
The pyrolysis rate is taken to be proportional to the radiant heat input to
the fuelbed and
![]() can thus be written as
can thus be written as
Where ![]() is a constant to be determined by experiment.
is a constant to be determined by experiment.
![]() is determined to a first approximation by taking the flame to be conical with
height
is determined to a first approximation by taking the flame to be conical with
height
![]() and base radius equal to the fuelbed radius,
and base radius equal to the fuelbed radius,
![]() .
For these assumptions
.
For these assumptions
![]() is given by
is given by
 (16)
(16)
When the pan-fuelbed distance becomes larger than the flame height, the latter is used as the height of the flame cone.
In Fig.10 the data on volatiles peak power are fitted to the Eqs.(5.40) and (5.41). Noting the simplicity of the model the agreement with experiment can be stated to be reasonable.
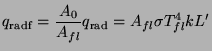
The use of a grate
From time to time we have presented discussions on the effect of a grate on the fire behaviour and consequences thereof. We have shown that radiative heat transfer can contribute to a substantial proportion of the total heat received by the pan particularly at small pan-fuelbed distances. In general the radiative heat transfer increases if we are able to concentrate the fuelbed in as small an area as is feasible for a given power level of the overall fire. Since a grate appears to provide a larger power density (22 as against 14 W/cm2, the fuelbed area for a given power level will be smaller with a grate than the one without. In general it is expected that a grate will facilitate the accessibility of air to the fuelbed. The benefits of a grate will become clearer if we look at the results in Fig.11. The figure compares fuelbed weight just before a fresh charge is added for fires with and without grate for a 10kW fire.
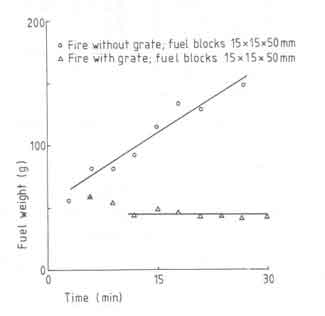
Fig.11. Fuelbed weight as a function of time with and without grate
It is seen that the fire without a grate has not attained a ''steady state''
during the experimental period, while the grate fire reaches the steady
state in a little over 10 minutes. In essence the figure suggests that grate
promotes the combustion of charcoal. Additional evidence for this is
provided in Table 7.
| Charcoal at the end of experiment (% of total heat) |
||||
| Power (kW) |
With grate | Without grate | ||
| 0% ash | 100% ash | 0% ash | 100% ash | |
| 2.6 | 5.6 | 4.0 | 8.5 | 6.9 |
| 3.1 | 6.0 | 4.4 | 9.5 | 7.9 |
| 3.9 | 3.6 | 1.9 | 7.6 | 6.1 |
| 5.2 | 2.7 | 1.2 | 8.5 | 6.9 |
| 5.6 | 4.5 | 2.9 | ||
| 7.8 | 3.5 | 1.9 | ||
The table above presents the fuelbed weight at the end of the experiment. While interpreting the results it is important to remember that not all the weight remaining at the end of experiment is charcoal. Some of it is ash. In these experiments no care was taken to separate ash from charcoal. Since we know the ultimate analysis of the fuel and we also know the total amount of wood used in the experiment, it is possible to provide an upper bound of the ash present in the remaining material at the end of each experiment. This has to be treated as the upper bound since the fire carries away certain amount of ash - the so-called fly ash. Thus the lower bound for the ash in the material left behind at the end of the experiment is zero ash. Thus the table provides two entries for each experiment - one corresponding to 0 ash (that is, all ash is carried away by the flames as fly ash) and the other corresponding to 100% is left behind).
The difference between the charcoal left behind with and without grate is quite significant, particularly in comparison to the efficiencies that hover around 25%. There is no easy way of making this last remnant of charcoal contribute to additional efficiency. The only possibility is to recover the charcoal and store it for future use.
Figure 6 shows that Pv, max remains constant for the nominal power range investigated. The small fuelbed thickness coupled with the constant Pv, max leads to a relatively constant efficiency of the open fire with nominal power output as could be gathered from Fig.5. This result is not influenced by the presence of a grate. Thus the major advantage to be gained by the presence of a grate is that the wood can be burned at a higher rate. In other words the power density - W/cm2 - is higher with a grate. The effect is that one could use a smaller area for the fuel bed. This may not be of great significance for the open fire user, but can be of sufficient importance for closed stoves since it can lead to more compact combustion chambers with consequent reduction in costs. However no exhaustive experiments on this aspect is available at this moment as we shall see later. In particular the present experiments were not performed to investigate the effect of reducing the grate size so as to match the power for a fire without grate.
The last point can be illustrated with a simple example. Consider a fire with a nominal power output of 5kW. Without a grate the fuel bed base area with a power density of 14 W/cm2 will be about 357 cm2 (21cm diameter). On the contrary the grate area need be only 225 cm2 (17cm diameter) since a power density of 22w/cm2 can be realized. If we assume the combustion chamber height is roughly equal to the fuel bed diameter, it seems possible to reduce the material use by 20% for a closed stove. The additional benefit would be an enhancement of the radiative heat transfer to the pan since the view factor between the fuel bed and the pan increases by about 10%. If we take the experience of gas burners which are compact, we can expect the convective heat transfer to also increase. Thus it is possible to expect that efficiency should increase with the use of grates. However the fact that flame height increases has not been accounted for in the above prognostications. The effect of this is to increase the combustion chamber height. Thus one has to modify all these estimates. As of to date neither sufficiently detailed calculations nor careful experiments have been performed to clearly delineate the benefits of a grate. Thus for the moment the benefit of the grate has to be taken more or less on faith.